How Polipad works
Simple Logic: find the real problems in your area, check whether the media coverage matches, add what matters to you, and see which leader measures up.
1. Find the real problems
We collect hard numbers from ten federal sources, then score each issue with a Problem Intensity Score: 50 is the national average, 80+ is a genuine crisis. So you can tell a real emergency from business as usual.
2. Check the story against the facts
We read the coverage and score how the same issue is talked about. The Perception Gap is the distance between the two. A big gap means the narrative and the numbers have come apart — sometimes a hidden crisis, sometimes an inflated fear.
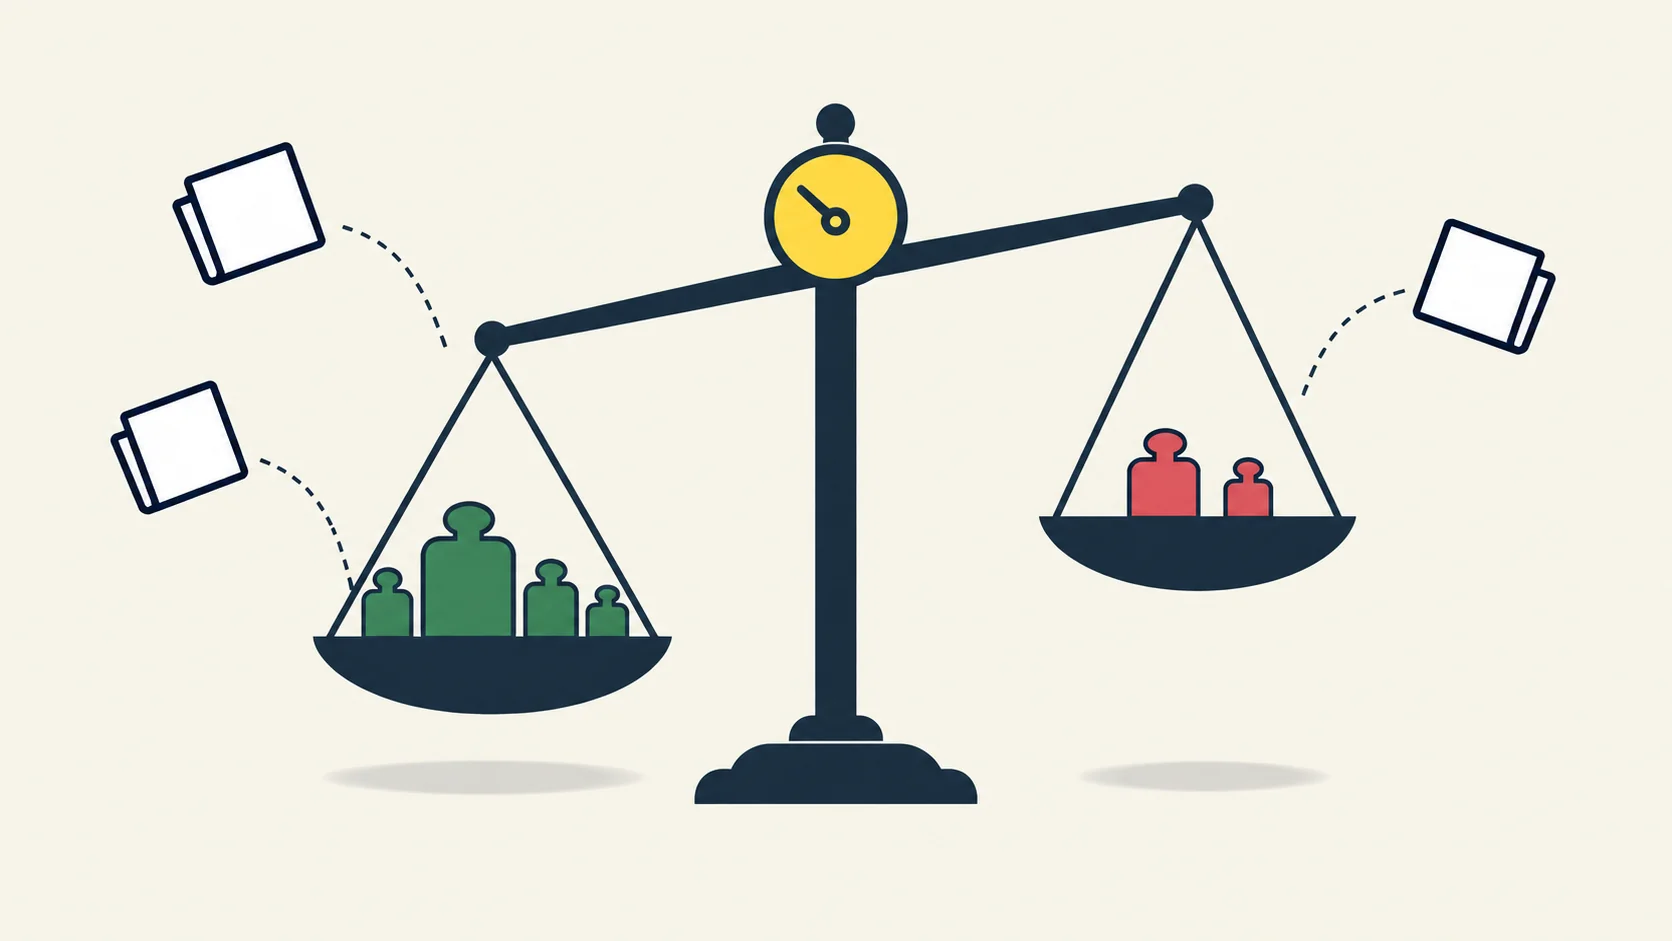 40 positives13 negatives
3a. WATT — how a leader comes across
WATT is a leadership unit. We read thousands of articles about a candidate and look for 40 positive qualities (honesty, courage, empathy, follow-through) and 13 negative ones (dishonesty, bullying, ducking blame). Positives push the score up, negatives pull it down. Praise from an opposing outlet is worth more than praise from a friendly one. It’s a perception score, not a verdict on ability.
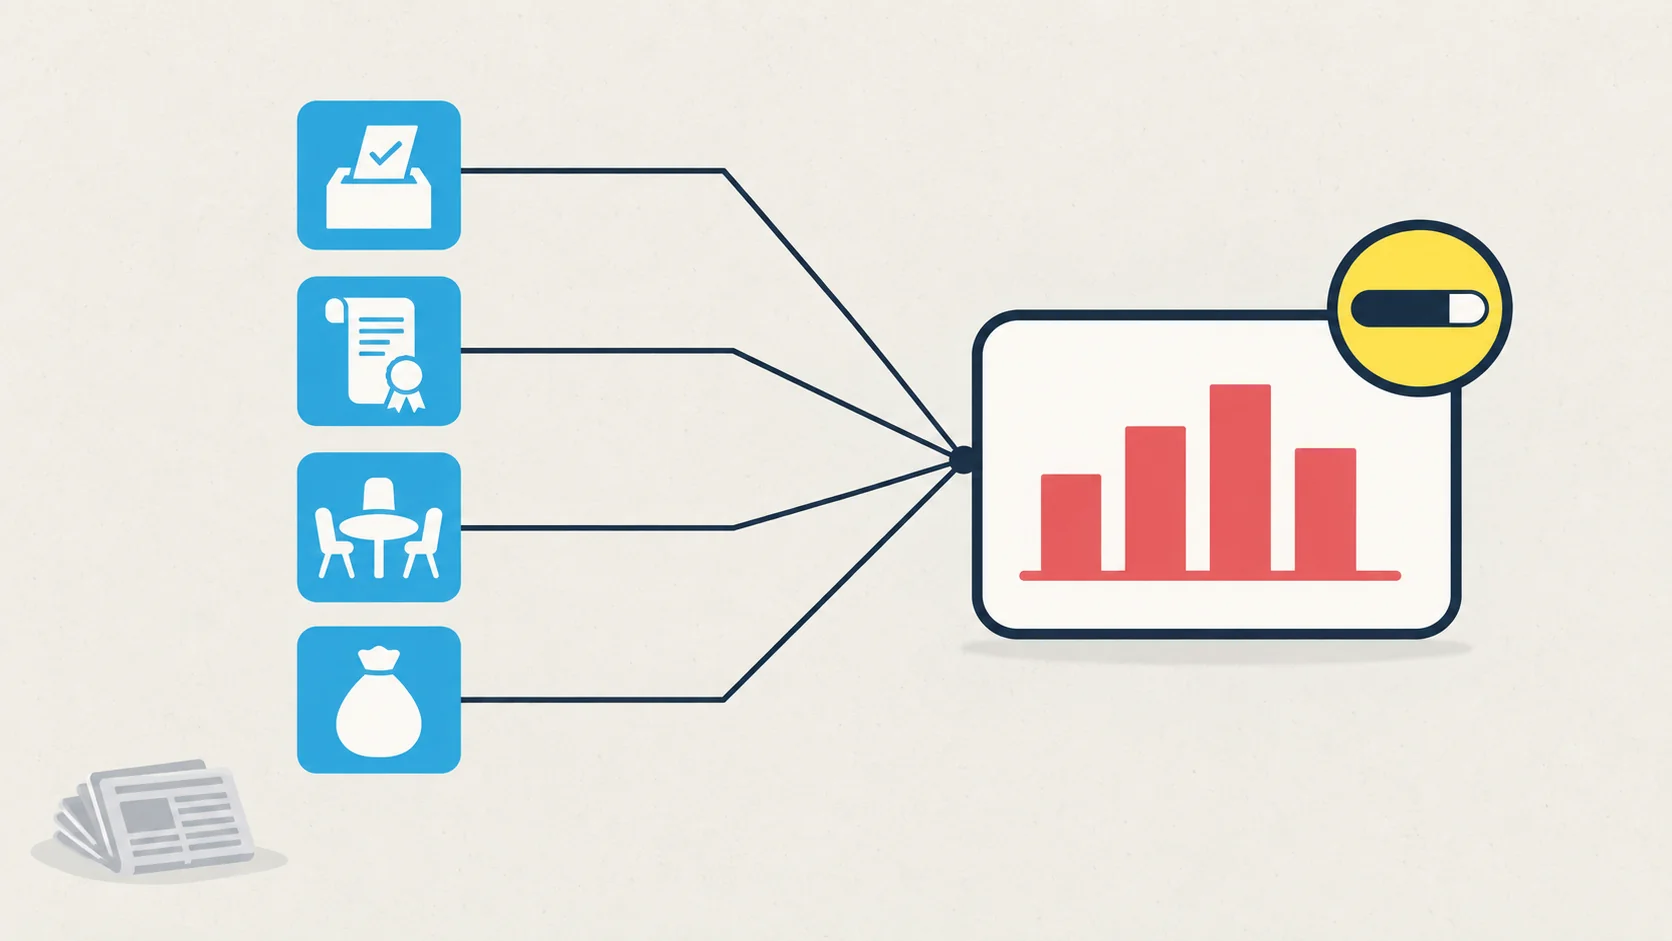 VotesBillsCommitteesMoneyYour state's problem0-10 scoreCoverage ignored
3b. Effectiveness — what the record proves
Coming across well is one thing. Getting things done is another. The Effectiveness Score (E-Score) ignores the coverage and looks only at the hard record: how a candidate voted, the bills they wrote, the committees they worked on, and the money they brought home. Then it lines that record up against your state’s real problems and asks a simple question: based on what this person has actually done, how much of this could they fix? The answer is a 0–10 score.
4. Candidate Matcher — your concerns, your match
Not every problem matters the same to every person. The Candidate Matcher starts with the real problems in your area, then lets you say how much each one matters to you — a lot, a little, or not at all. It combines your priorities with each candidate’s WATT and Effectiveness scores and shows you who lines up best with what you care about. Same numbers for everyone, but the ranking is yours.
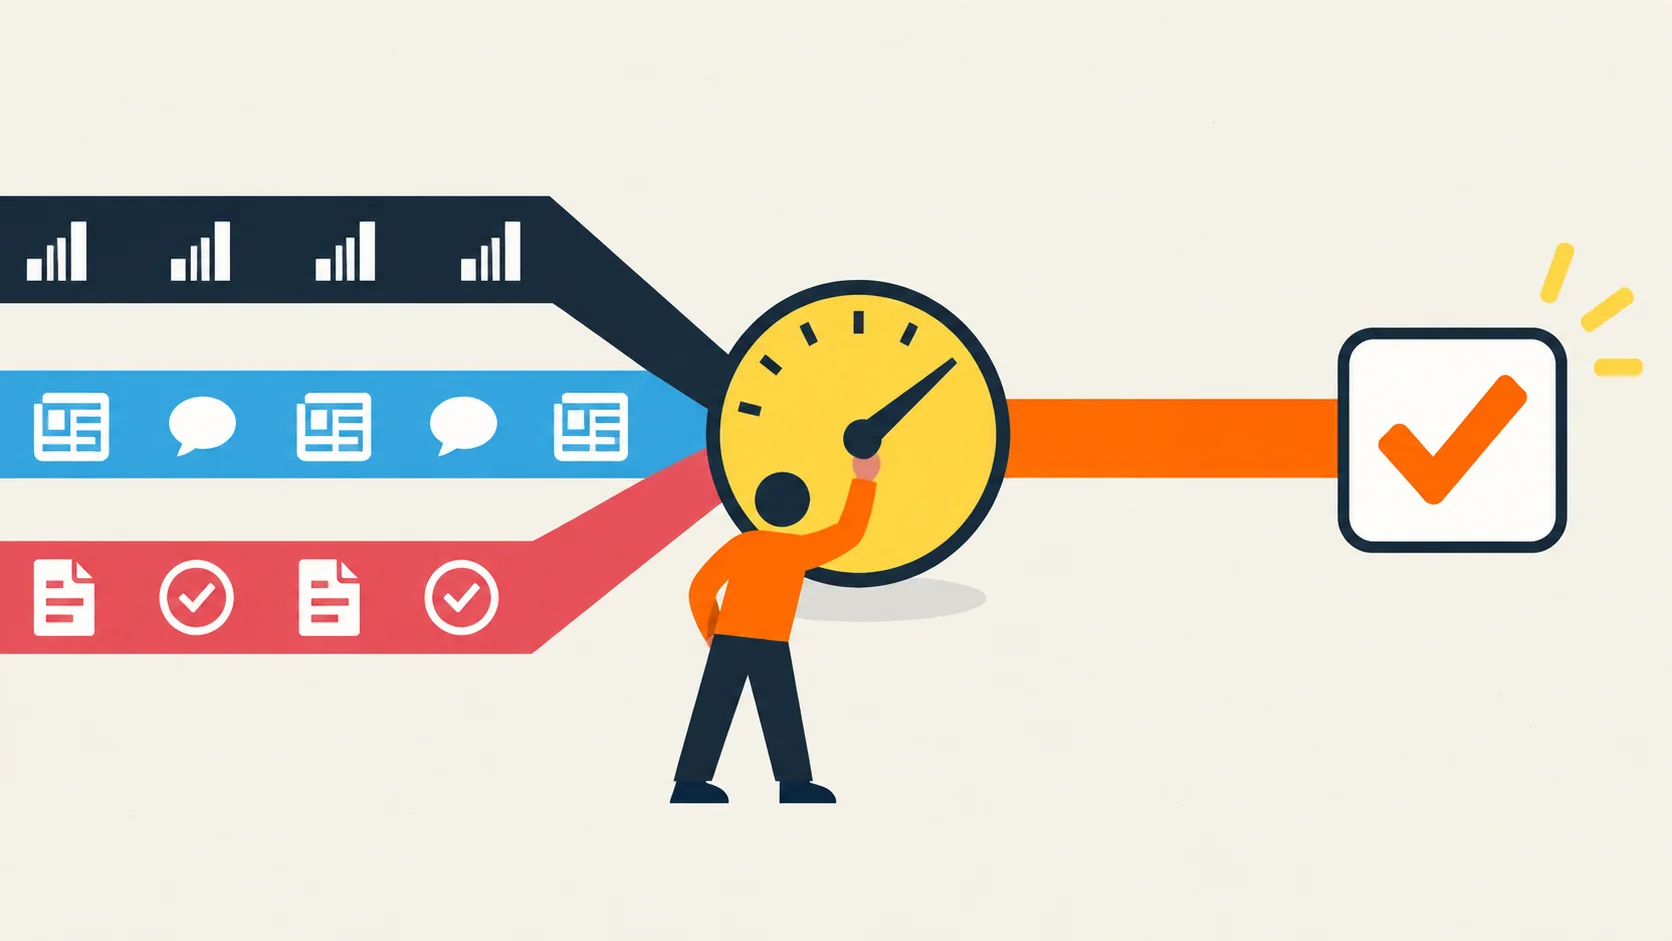 Hard dataNews coverageCandidate recordsYour prioritiesYour match
Now, add your own judgment, and vote.
Perfect objectivity isn’t possible. So we promise the next best thing.
Transparency
Every score traces back to a named, public source you can check yourself.
Consistency
The exact same process runs for every candidate and every state — no thumb on the scale.